7 Must-Have Dashboard Features for Business
Introducing the transformative world of low-code platforms, where businesses unlock the potential of streamlined development and enhanced data management. Within these platforms, the dashboard takes center stage, offering intuitive interfaces and powerful features for data visualization and analysis. Explore the fusion of low-code technology and dynamic dashboards, driving efficiency and informed decision-making like never before.
One essential part of every business is the dashboard builder, which empowers users to create and deploy intuitive and visually appealing dashboards without the need for advanced programming skills. Dashboards serve as centralized hubs that display critical data, key performance indicators (KPIs), and other relevant information in a user-friendly and interactive manner. Users can customize these dashboards, arranging and visualizing data in ways that best suit their specific needs and objectives. This user-friendly approach to dashboard creation allows individuals and businesses to make data-driven decisions and monitor important metrics with ease, without requiring extensive technical expertise.
Kovaion’s Low-Code Development Platform offers a range of advanced and powerful dashboard features, providing users with superior application development experience. Let’s dive into the 6 must-have dashboard features for every business, interconnecting with Kovaion’s Low-Code Development Platform.
1. Customizable Dashboards
Under the interactive dashboard feature, the most commonly mentioned is customization. A customizable dashboard allows you to select the specific data points and visualizations that are visible to you.
In today’s fast-paced business landscape, having a customizable dashboard is paramount. Low-code platforms have revolutionized the way businesses harness the potential of their data. Customizable dashboards, in particular, are a game-changer.
With the flexibility provided by low-code platforms, businesses can effortlessly tailor their dashboards to match their unique needs and objectives. Whether it’s rearranging widgets, adding new data sources, or adjusting visualizations, the power to customize is at your fingertips. This ensures that the dashboard aligns perfectly with your business goals, making data-driven decision-making a breeze.
2. Charts
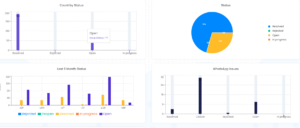
Kovaion’s Low-Code platform enriches the user experience by offering a diverse range of chart types, including bar charts, pie charts, column charts, and multi-bar charts. These chart options enhance the platform’s usability and data visualization capabilities, providing users with the tools to effectively convey and interpret data. Here’s how these chart types contribute to an improved user experience:
- Bar Charts: Bar charts are excellent for displaying comparisons between different categories or data points. They make it easy for users to visualize variations and trends within their data, promoting better understanding and decision-making.
- Pie Charts: Pie charts are ideal for illustrating the distribution of data across categories or showing the composition of a whole. They offer a clear and concise representation of percentages and proportions, aiding users in grasping data distribution at a glance.
- Column Charts: Column charts are similar to bar charts but display data vertically. They are effective for showcasing data trends over time or comparing multiple data sets. Column charts provide a visually appealing way to present data for improved comprehension.
- Multi-Bar Charts: Multi-bar charts, also known as grouped bar charts, allow users to compare multiple data series within the same category. They enable users to analyze and contrast data across various parameters, leading to more comprehensive insights.
By offering these four types of charts, Kovaion’s Low-Code platform empowers users to select the most suitable visualization method for their data, facilitating clearer and more impactful communication of information. This versatility in chart options contributes significantly to an enhanced user experience, making data analysis and reporting more efficient and insightful.
3. Table
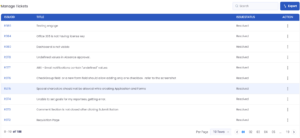
Kovaion’s Low-Code platform empowers users to seamlessly integrate tables into their applications, enabling the presentation of combined or tabulated data. This feature offers several functionalities to enhance the user experience:
- Data Combination: Users can easily aggregate and display data from various sources or datasets within a single table. This capability allows for a comprehensive view of information, streamlining data analysis.
- Export Option: The platform provides an export feature, enabling users to download or export the table data in different formats, such as CSV or Excel. This functionality facilitates data sharing and reporting.
- Search Functionality: Users can efficiently search for specific data within the table using search filters or queries. This search functionality simplifies the process of locating relevant information, especially when dealing with extensive datasets.
- View Action Button: The platform enhances interactivity by incorporating a “View” action button. Users can click this button to access additional details or a detailed view of a specific data entry or record directly from the table. This feature promotes ease of use and quick access to more in-depth information.
By providing these features within its table component, Kovaion’s Low-Code platform enhances the usability of data tables, making it easier for users to work with and extract insights from their data
4. The Ability to Export Data as a Report
In today’s data-driven business landscape, having a powerful dashboard is crucial. One of the top features that should be on your radar is “The Ability to Export Data as a Report.” With low code platforms gaining traction, this functionality empowers users to seamlessly extract valuable insights from their data.
Dashboard solutions equipped with this feature enable users to effortlessly transform raw data into visually appealing reports. Whether it’s sales figures, customer analytics, or performance metrics, the ability to export data as a report simplifies the process, saving time and effort. Elevate your business intelligence by incorporating this must-have feature, and watch your data-driven decision-making reach new heights.
5. Show Count Data
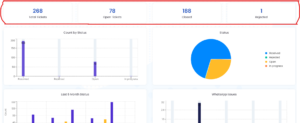
Our Kovaion’s Low-Code platform provides a card-based interface that allows users to display specific data counts, much like the example shown above. Users have the flexibility to assign custom names to these cards, tailoring them to their specific requirements. Furthermore, users can retrieve count data from collections of their choosing, offering the ability to select and showcase data points, such as the count of items with a “status open.”
6. Filters
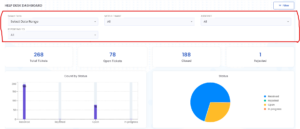
Kovaion’s Low-Code platform boasts a versatile filtering system, catering to two distinct types of filters to enhance the user experience;
- Date Filters: This feature empowers users to refine their dashboard data by selecting specific date ranges. Users can easily view data within a specified time frame, enabling them to analyze trends, performance, or any other relevant metrics within those date boundaries. Date filters are particularly valuable for time-sensitive data analysis and reporting.
- Value-Based Filters: In addition to date filters, the platform offers value-based filters that allow users to narrow down the dashboard data based on criteria, such as module names or status. Users can selectively filter and display data that aligns with their specific needs and interests. This functionality enhances the user experience by providing a more targeted view of the data, making it easier to extract meaningful insights.
These two types of filters collectively offer a comprehensive filtering solution, empowering users to tailor their dashboard views to their precise requirements. This flexibility ensures that users can access the information they need, fostering a more intuitive and efficient experience within the platform.
7. Dashboard With Roles Security
Kovaion’s Low-Code platform includes a powerful feature that allows users to create role-based dashboards. This functionality offers advanced control over dashboard access and content, ensuring that the right individuals see the appropriate information. Here’s how this feature benefits users:
- Role-Based Access Control: Users can define specific roles or user groups within the platform. Each role can be associated with a set of permissions and restrictions.
- Customized Dashboard Views: For each role or user group, administrators or users with appropriate permissions can tailor the dashboard content. This means they can determine what data, widgets, charts, or information each role can access and view.
- Data Security: Role-based dashboards help in enforcing data security and privacy. Users can control who has access to sensitive or confidential information, preventing unauthorized individuals from viewing it.
- Enhanced User Experience: Role-based dashboards provide a personalized experience for users. This ensures that individuals only see the data and metrics relevant to their roles and responsibilities, making it easier for them to make informed decisions.
- Administrative Flexibility: Administrators can easily manage and update roles and permissions as organizational needs change. This flexibility simplifies the process of adapting the platform to evolving requirements.
The Bottom Line
Overall, the ability to create role-based dashboards enhances data governance, security, and user experience within Kovaion’s Low-Code platform. It enables organizations to fine-tune dashboard access and content based on individual roles, promoting efficient and secure data utilization.
If you’re seeking powerful dashboard analytics tailored for informed decision-making, consider embracing the versatility of Kovaion’s low-code platforms. Customize your dashboard analytics to suit your unique needs, and explore our offering of captivating Power BI dashboards for visually stunning and advanced insights.