Personal Analytic Notifications – PeopleTools 8.57
Introduction to “Personal Analytic Notifications” – PeopleTools 8.57
Personal Analytic Notifications feature introduced in PeopleTools 8.57 allows direct notifications and alerts via thresholds to end-user. Pivot Grids are used to define the thresholds. Users can take action directly from the notifications.
What is a Pivot Grid?
PeopleSoft Pivot Grid is used to visualize relational data sources in a multi-dimensional UI. Pivot grids enable end-users perform complex analysis on available data. The framework also enables you to see different views of the data, as in a Microsoft Excel pivot table, and the same data is also available in a chart view.
Using Pivot Grid, you can view data in these different visualizations:
- Pivot Grid only:
You are able to view the operational reporting data in a grid, where data pivoting, slicing, and dicing is possible.
- Chart only:
You are able to view the operational reporting data in a chart, change the axis, filter the results, and drill down to other dimensions and detail.
- Pivot Grid and chart:
You are able to view the operational reporting data in both a grid and a chart. The data between the grid and the chart is synchronized.
Thresholds
Thresholds enable you to define important points in your data and sends out notifications for appropriate actions. Introduced with PeopleTools 8.57, threshold and notifications have a standardized approach for using them across all applications.
Users can now set thresholds in pivot grids and then get notified about them via email or alerts when the criteria are met. There will be only one Notification for all threshold violations in a single module, so users will not be overwhelmed with multiple alerts if several thresholds are met in a specific module.
How to configure Thresholds?
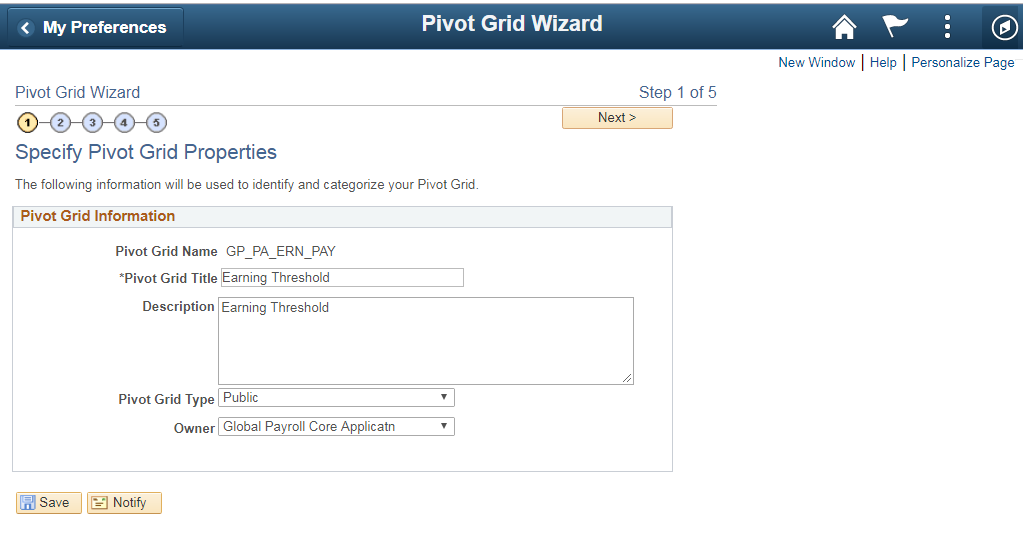
Navigation: Main Menu > Reporting Tools > Pivot Grid > Pivot Grid Wizard.
Step 1: The Following information will be used to identify and categorize your pivot grid.
Step 2: Select the Data Source Type and the Columns for the Pivot Grid.
Step 3: Specify the Column Type and the Aggregate function for the selected Data Model.
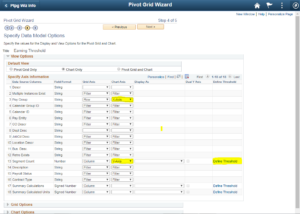
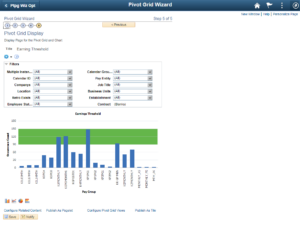
Step 4: Specify the values for the Display and View Options for the Pivot Grid and Chart.
- Click on the Define Thresholds link displayed under Define Threshold column in the Specify Axis Information grid.
Types of threshold available:
- Range: Pivot Grid displays the Lower Limit and Higher Limit fields that enable you to specify a range of minimum and maximum threshold values.
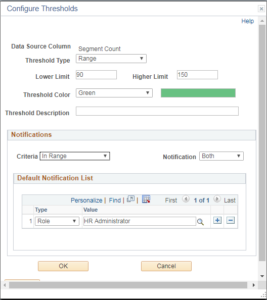
- Click OK and press next button.
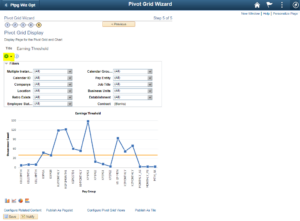
(ii)Distinct: This value is plotted on the chart as a single line. In the grid any value crossing the distinct threshold value has the grid cell marked with color.
- Set the threshold value Distinct, Click OK and press next button.
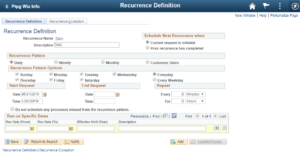
Steps to Configuring Notification Frequency:
Navigation: PeopleTools > Process Scheduler > Recurrence
Navigation: Reporting Tools > Pivot Grid > Pivot Grid Administration > Notification Frequency
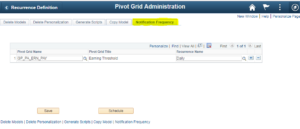
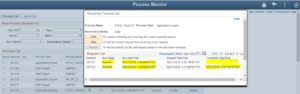
- Select the Pivot grid name, Recurrence name and click on schedule.
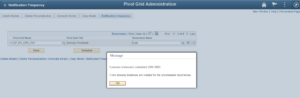
- The process is now scheduled and emails are triggered based on the configuration
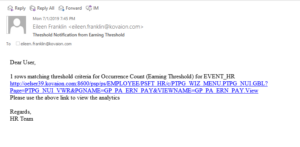
View Analytics
Business Benefits
- Increased communication, accuracy and timeliness
- Enables swift response to any changes or opportunities
- Ease of configuration without any technical assistance
Author: Detroja Kishan V, PeopleSoft Consultant, Kovaion