HCM PUM 39 Kibana Analytics Overview of Payroll Costs
HCM PUM 39 Kibana Analytics – An Overview of the Payroll Costs for a Company
The Peoplesoft HCM Update Image 39 (PeopleTools 8.59) recently released in August 2021 which includes few features like redesigned Homepage including movement of recently used pages, homepage dropdown option and notifications. The Global Search field is at the top of the homepage allows you to search content of recently visited items or pages according to the security the user has access to.
1] Kibana Analytics
- Payroll and Global Payroll Insight Dashboards
Payroll and Global Payroll Insight Dashboards
- Kibana Dashboard for Payroll Applications
- Management to determine the Payroll costs for the organization quickly and easily.
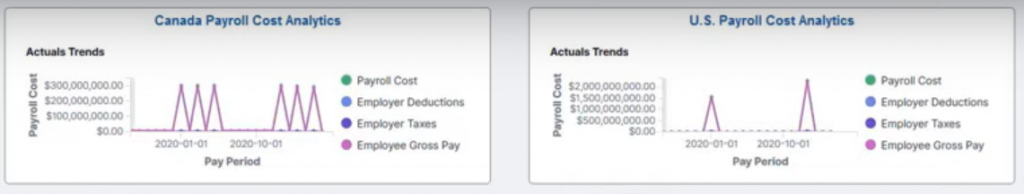 Dashboard is available for in for Payroll for North America and Global Payroll
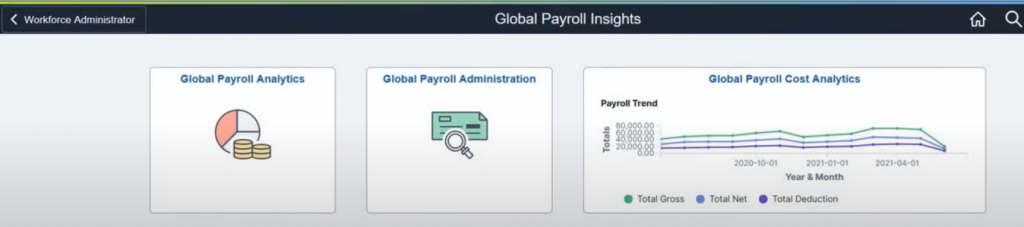 Dashboard for Global Payroll:
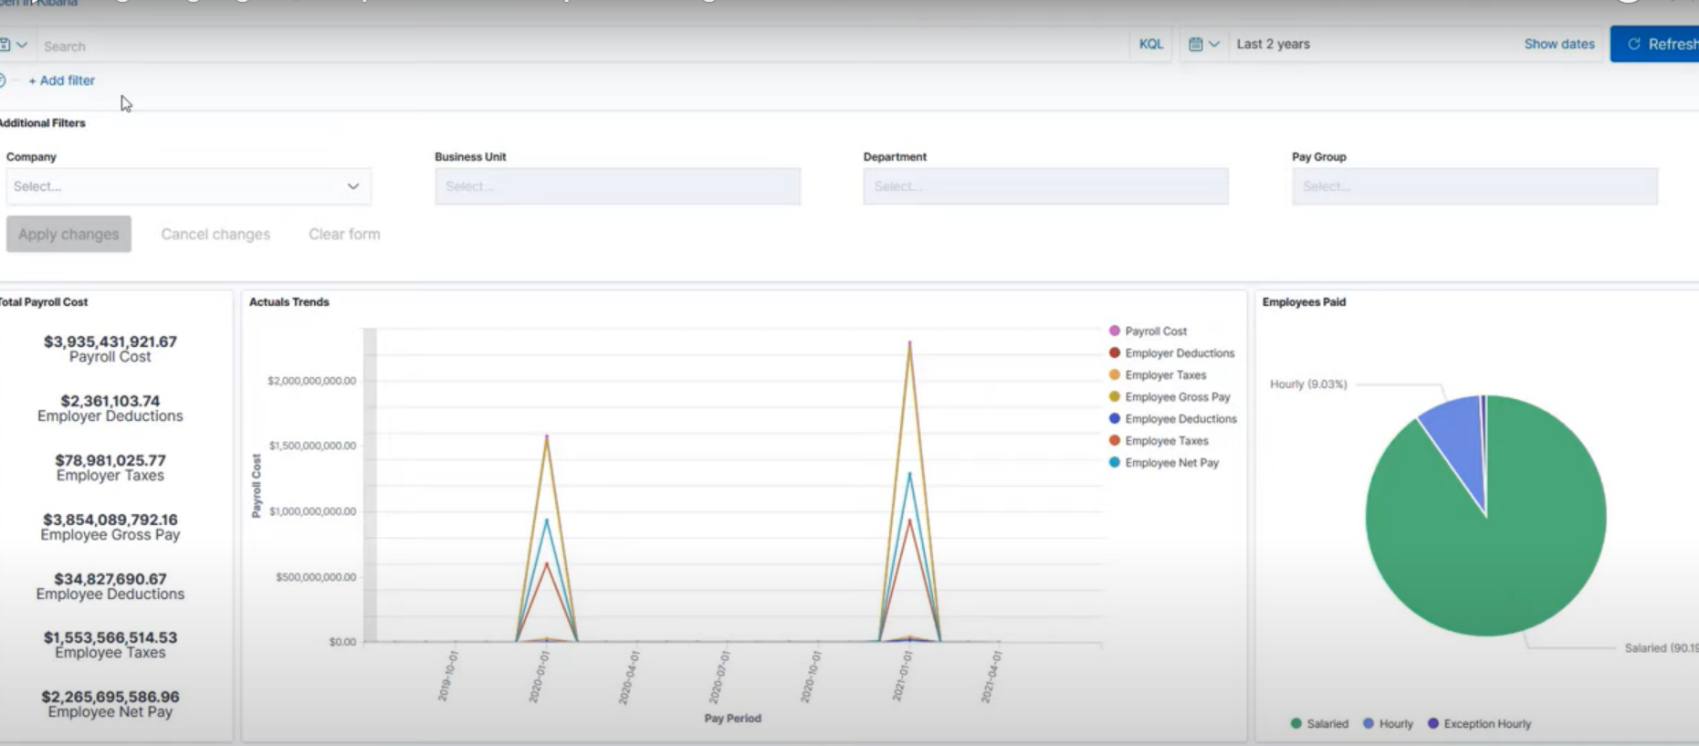
Like any other Kibana Dashboard one can add filter as in the US Dashboard below. One can see the data charts based on the filters and selecting the date range. The US and Canadian Dashboard can be selected based on the Company, Business Unit, Department and Paygroup.
The Global Payroll Dashboard provides a currency filter. If one chooses a local currency, the filter is done based on the local currency and the countries using that currency.
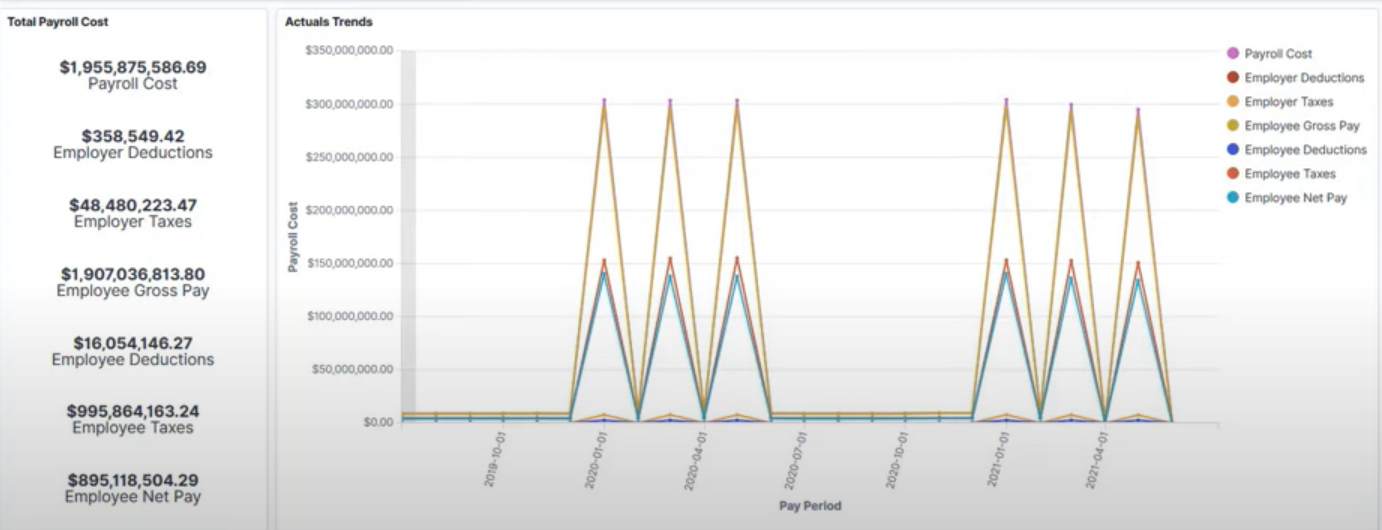 The visualization includes the dashboard in different chart forms to best present the data. A simple list to show the Total Payroll Costs and its break-down numbers and a line chart to show the different Payroll Actuals
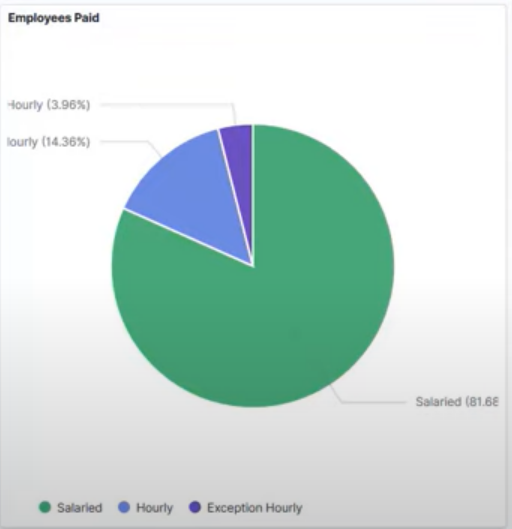
A pie-chart to show employee population by Employee classification. Same is available for Global Payroll.
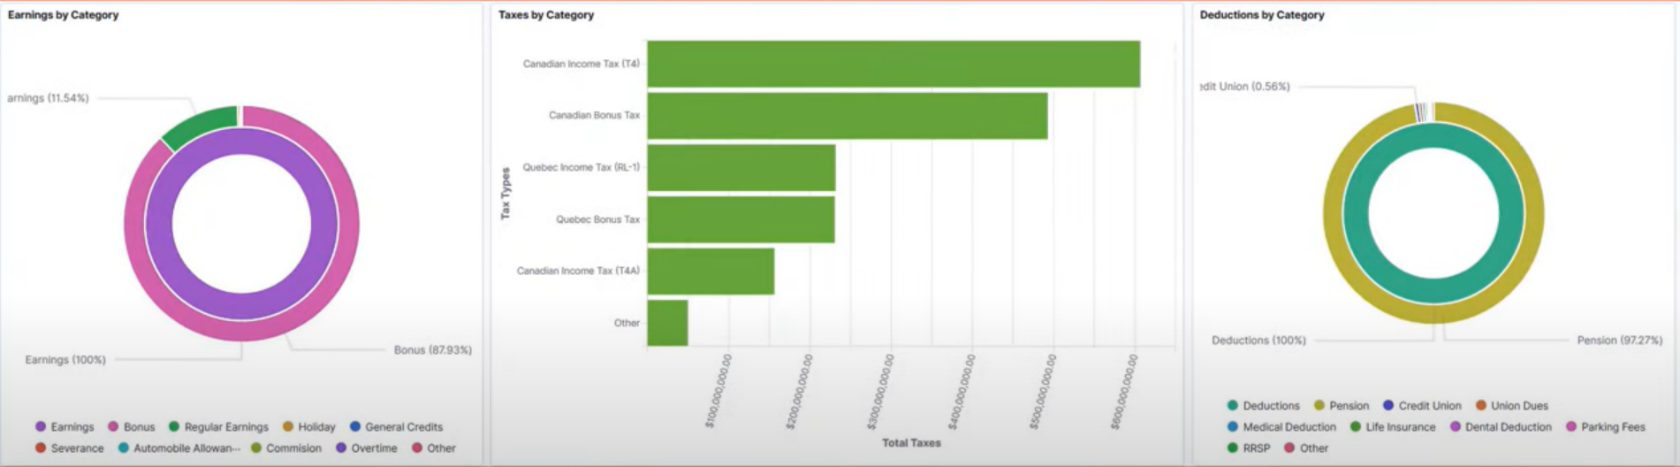 Layered Pie-Charts to show Total Earnings by Category and Total Deduction by Category and a bar-chart to show Taxes by category. A bar char for displaying the employer and employee taxes by category.
In the Global Payroll, the line chart is available that displays category trends.
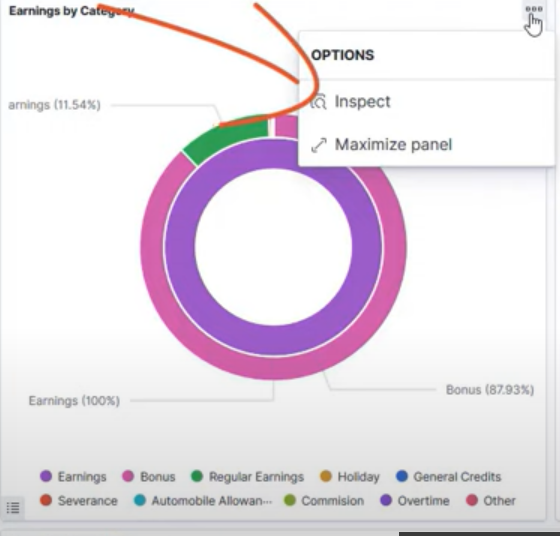
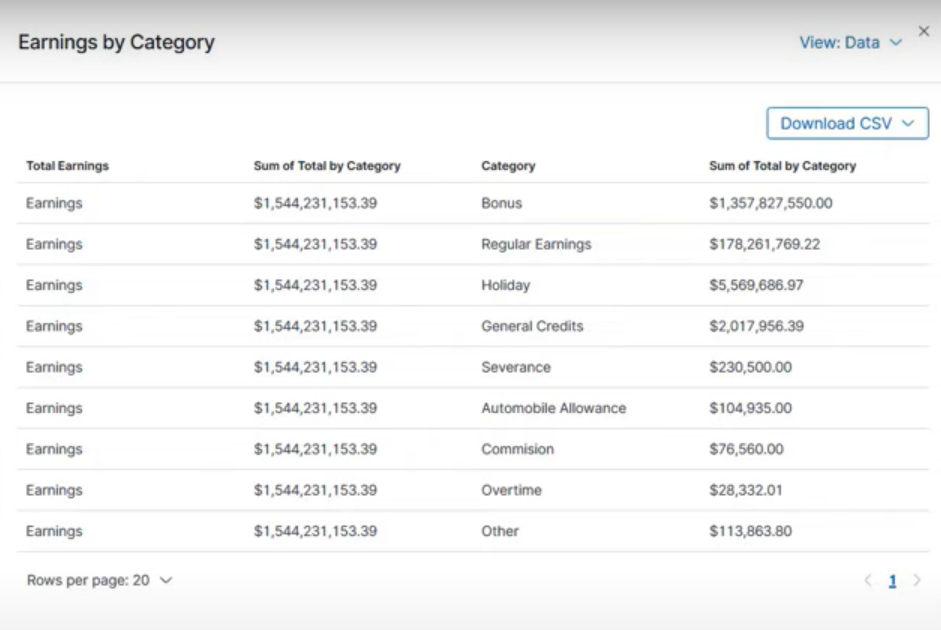
One can use the Inspect option to break-down the data used to build the pie-chart and download the data to an excel spreadsheet, if needed.
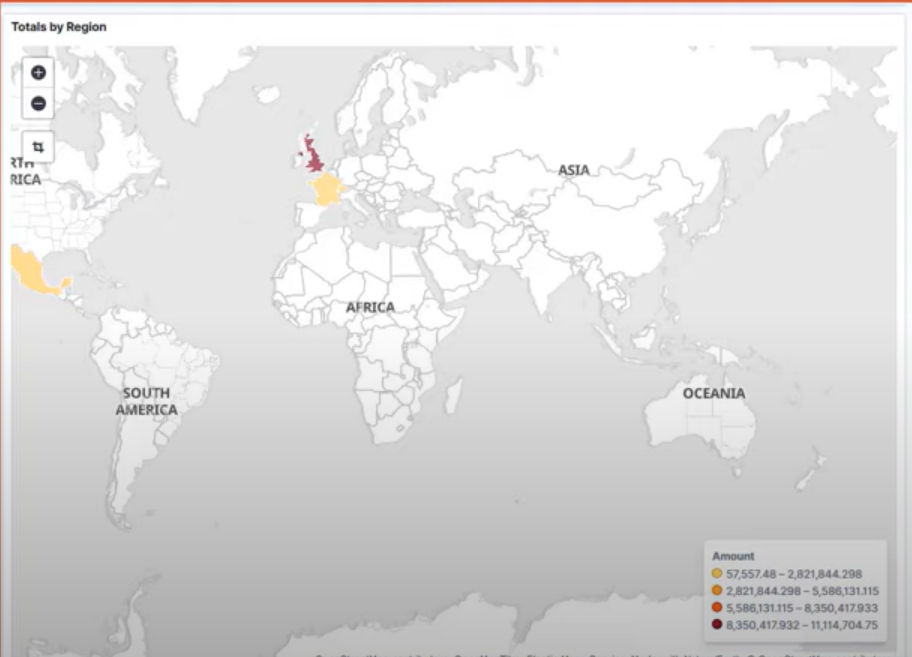 In the Global Payroll, one can use the Map visualization to view the Total Payroll Costs by Region. In the US and Canadian Dashboard, you can filter by States and Province.
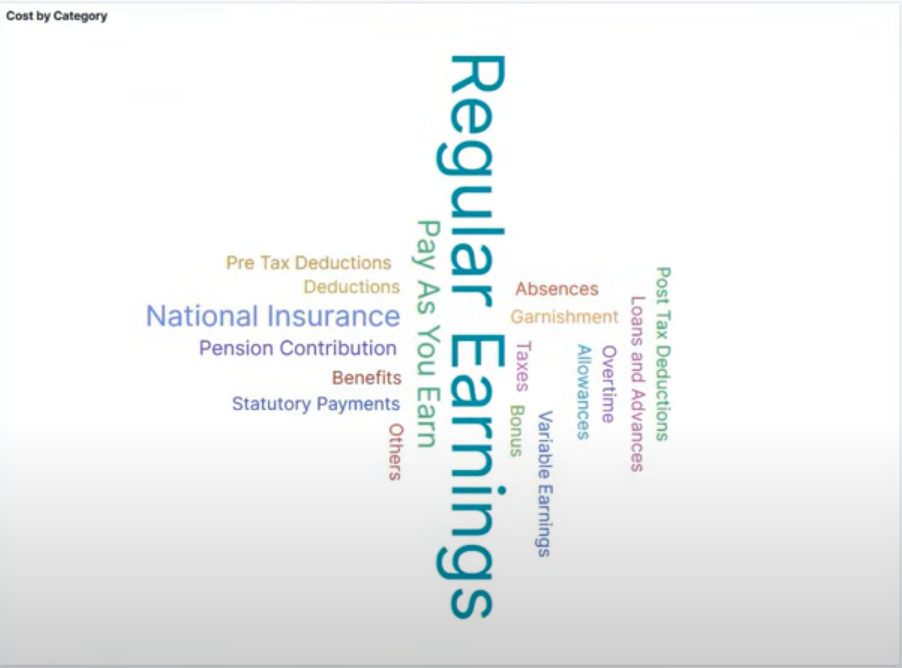
The Tag Cloud visualization displays terms of Common Payroll. Costs like base salary, overtime, employer deduction and so on based on the based on the categories one defines. The larger the font size the higher the payroll cost.
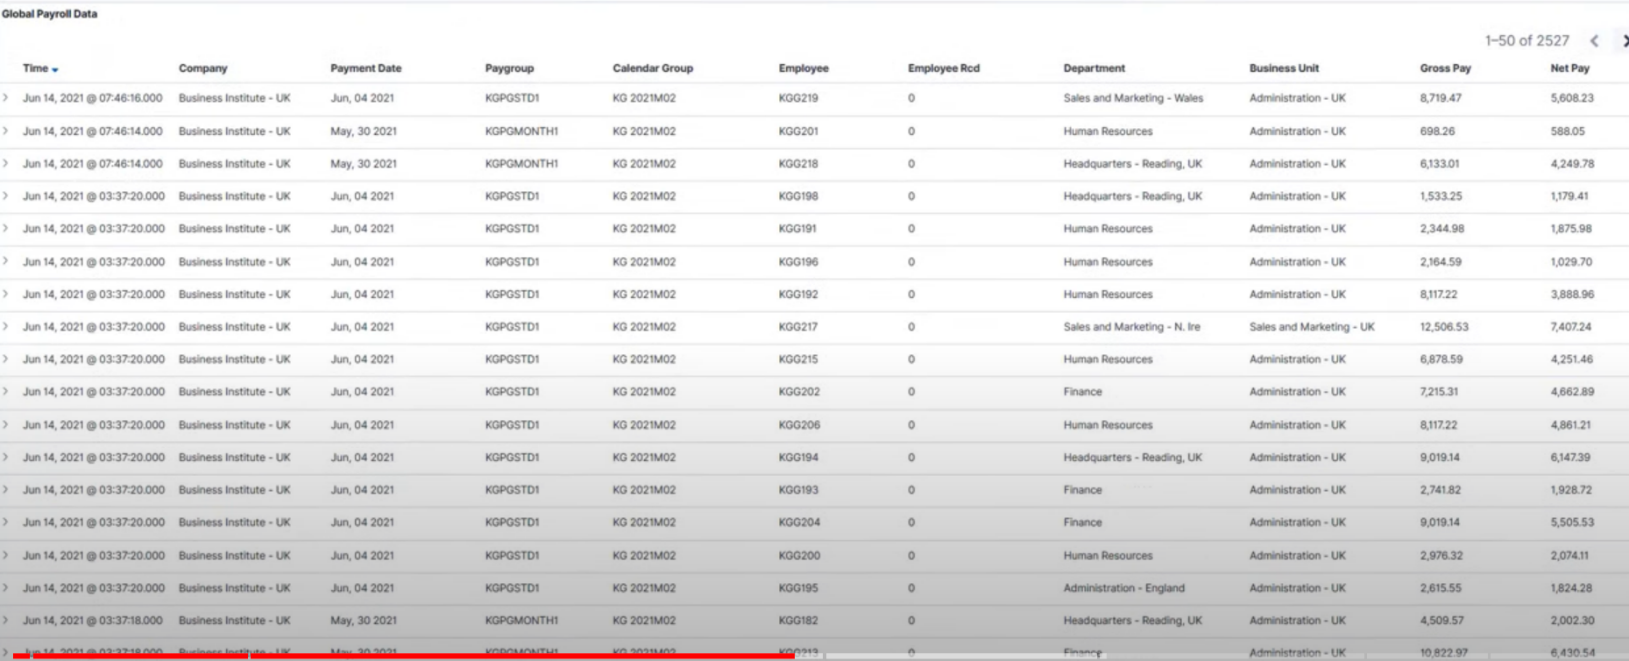 The grid at the bottom of the dashboard shows all the data used in the visual report in the grid format you can add filters to further refine data with or without the selected fields values
Author
Vinay M G
Kovaion PeopleSoft Practice