PeopleSoft Pivot Grid
The PeopleSoft Pivot Grid is a reporting tool used to provide a pivot table and chart representation of live data using PS Query data source. This enables users to visually display data in a dashboard. Data can be displayed in different views by performing operations such as pivoting and filtering, which enables business analysts to interpret data in a variety of ways.
By Using Pivot Grid, you can view the data in these different visualizations like:
Pivot Grid only
- You can analyze operational reporting data in a grid format, allowing for data pivoting, slicing, and dicing functionalities.
Chart only
- You have the capability to visualize operational reporting data using charts, adjusting axes, applying filters, and exploring other dimensions and details through drilldowns.
- Furthermore, you can switch from a chart-only view to a grid display, enabling actions like pivoting data, interactive dragging and dropping, as well as slicing and filtering data to modify the grid’s arrangement. Once the layout meets your requirements, you can seamlessly synchronize the chart with the grid view.
Pivot Grid and chart
- You can visualize operational reporting data in both tabular and chart formats, with synchronized data between the two representations.
Business Benefits:
- PeopleSoft pivot grids can be published as pagelets, so can be published on the home page or any other navigation.
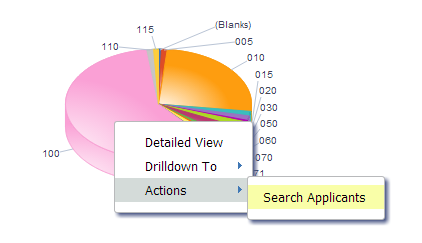
- Users can take action directly from the chart/report. – Related Content can be configured in the Pivot grid.

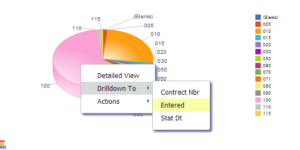
- Drilling Down on the Aggregate Values
- Inter Window Communication: Pivot Grid Pagelets can interact with each other and with the transaction pages. Configure Publication and Subscription with all the intersecting Prompt and Filter values between Pivot grids. We get the consistent behavior with progressive filtering in the publisher and subscriber.
- Pivot grids can be published as Related Content on any of the components, so that the user can refer to them easily.
- Displaying Grid from Chart-only view – Display the grid from a chart-only view and then perform various actions such as pivoting data, dragging and dropping, and slicing and filtering data to change the grid layout. After the layout is satisfactory, you can synchronize the chart with the grid view.
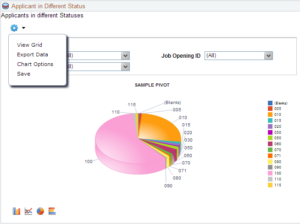
- View grid option allows the user to display the results of the query in grid format and filters can be applied.
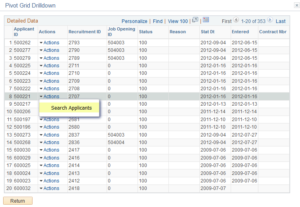
- PeopleSoft Pivot Grids allow the user to analyze data within the PeopleSoft application. The advantage here is that, as we all know, initial data analysis often leads to more questions and a need for deeper analysis. PeopleSoft Pivot Grids allow the user to dive deeper, all the way down to the transactional level into the system to grab more data for the desktop spreadsheet. It is cleaner, easier and more efficient.
- Pivot Grids PeopleSoft allow the user in a specific job role to focus on the activities that are most important to their specific job requirements. The user can immediately access the most Relevant information for their role. Information is easily prioritized, and action lists can be created.
The development process for Pivot Grids is streamlined into five stages:
Step 1: Navigation:
Access the Pivot Grid Wizard through Main Menu -> Reporting Tools -> Pivot Grid.
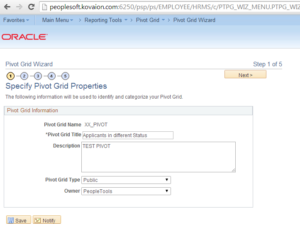
Step 2: Basic Details:
Provide essential information such as grid name, title, and type.
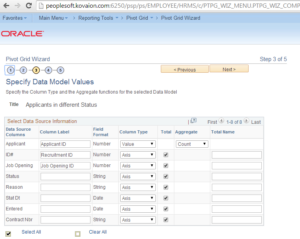
Step 3: Data Source and Model:
Specify the data source type and PS Query name. Configure data model values, including axis and column details.
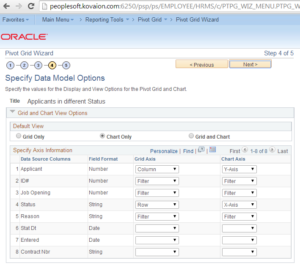
Step 4: Axis and Filters:
Define X and Y axes and establish filtering criteria.
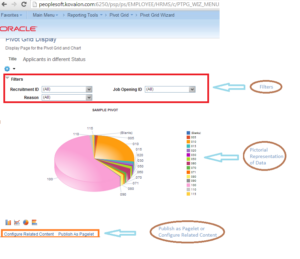
Step 5: Verification and Publication:
Verify the Pivot Grid’s configuration and publish it as pagelets or related content.
Limitations on Pivot Grid:
- Supports only PS Query as data source.
- Pivot Grid Does not have a Vertical Scroll bar for viewing data, but it displays all possible rows based on the current layout.
- Performance when dealing with extensive datasets.
The Bottom Line
PeopleSoft Pivot Grids empower users with dynamic and synchronized data visualization tools. The tool’s versatility spans various visualization modes, and its integration within the application environment enhances usability and decision-making.
Author: Dilip Kumar, Peoplesoft Consultant