Enhancing HR Management with Power BI: A Comprehensive Analytics Report
In the fast-paced corporate landscape, data-driven decisions have become paramount, especially in Human Resources (HR) management. The ability to harness valuable insights from HR data can transform the way organizations manage their workforce. In this blog, we delve into a comprehensive HR Analytics report created using Power BI, highlighting its functional aspects, target audience, and the distinct advantages it offers over other reporting tools.
Who can benefit from this report?
Empowering HR Professionals and Leadership. The HR Analytics report is tailored to meet the needs of various stakeholders:
- HR Managers: This report quips HR managers with the insights needed to make informed decisions about workforce planning, performance improvement, and employee engagement strategies.
- Department Heads: Department-specific pages allow department heads to monitor their teams’ performance, track attrition rates, and take targeted actions to optimize productivity.
- Executives and Leadership: C-suite executives can use the report to gain a holistic view of the organization’s workforce health, guiding strategic decisions about resource allocation and future planning.
Functional Aspect: Unveiling Insights through Data Visualization
The HR Analytics report is divided into seven distinct pages, each addressing specific aspects of workforce management:
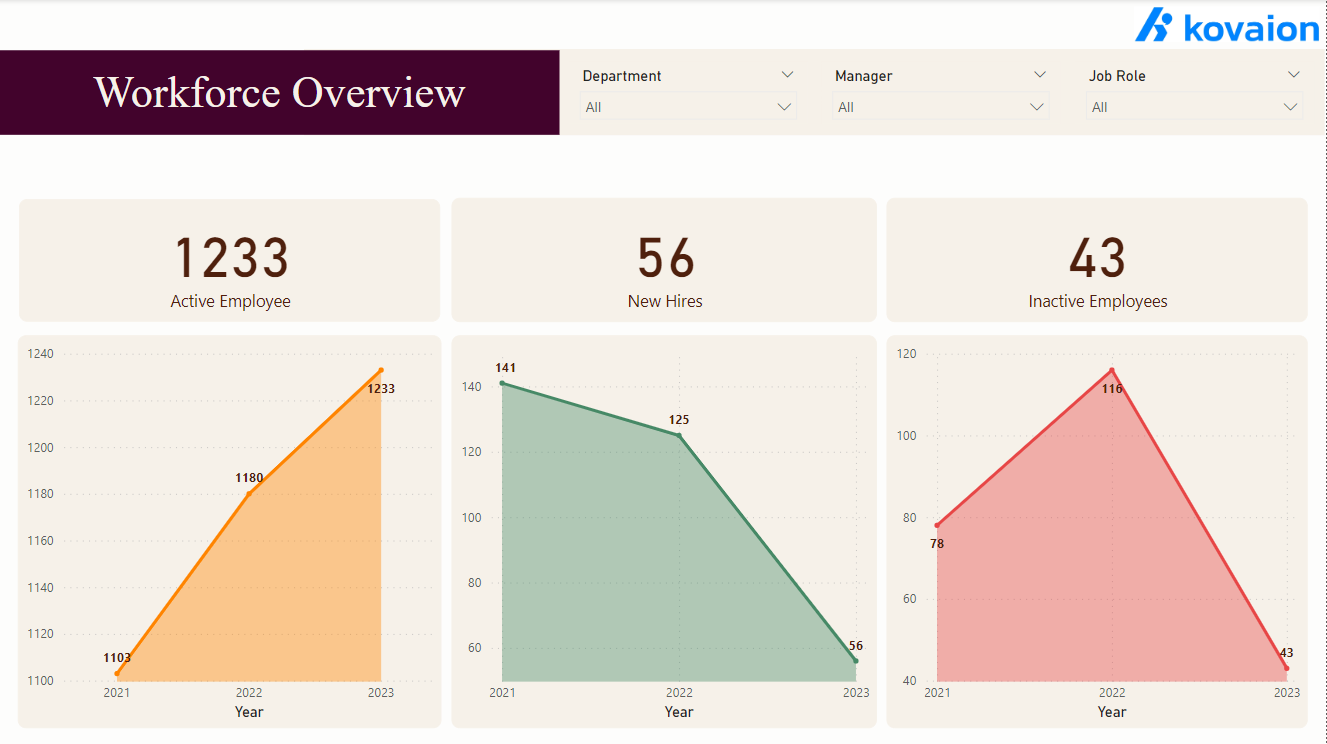
- Workforce Overview: This page provides a high-level snapshot of the employee trends over three years through line charts for active employees, new hires, and inactive employees. Slicers for department, manager, and job roles enable customized analysis, while card visuals display default metrics for the current year.

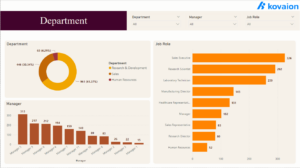
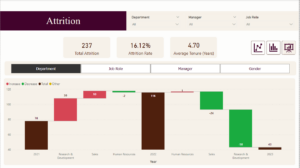
- Department: This page features pie, column, and bar charts showcasing employee distribution by department, manager, and job role. Slicers for department, manager, and job roles enable tailored analysis, fostering interactive exploration. This page offers comprehensive insights for resource allocation, talent management, and data-driven decisions.
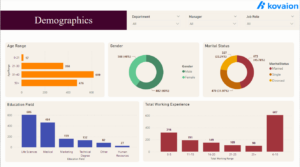
- Demographics: By showcasing demographic information such as gender distribution, age distribution, marital status, educational field diversity and total working experience, this page helps HR managers gain a comprehensive understanding of their workforce’s composition.
- Attrition: The Attrition page addresses employee attrition insights through a multi-faceted approach. Three cards provide key metrics: Total Attrition, Attrition Rate, and Average Tenure in years.
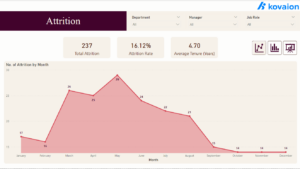
- The first view uses a line chart to depict monthly attrition numbers.
- The second view, customizable through toggles, employs a 100% stacked column chart to illustrate employee distribution across parameters like department, job role, manager, and gender, highlighting attrition as a legend.
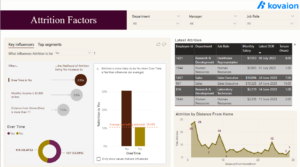
- Attrition Factors: This page emphasizes comprehensive attrition analysis: a matrix visual displaying employee details sorted by latest attrition, a key influencer visual depicting attrition factors including overtime, monthly income, distance from home, employee distribution by overtime (Yes/No), and an area chart tracking attrition trend based on distance from home. The consistent use of slicers ensures precise filtering for deeper insights into employee attrition drivers.
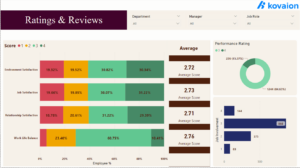
- Ratings & Reviews: This page’s visuals present employee feedback insights. These visuals encompass factors like environment satisfaction, job satisfaction, relationship satisfaction, and work-life balance, showcasing scores as a percentage stacked chart. Additionally, average scores for each factor are highlighted in card visuals. A pie chart illustrates performance rating distribution among employees, while a bar chart provides insights into job involvement scores. The page emphasizes effective visualization to understand and analyze employee perceptions and engagement.
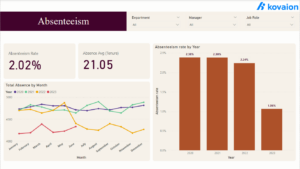
- Absenteeism: The Absenteeism page showcases critical insights related to employee absenteeism. Through a column chart, the absenteeism rate is visualized across different years, providing a clear overview of trends. A line chart with a month-year legend illustrates the total absence, allowing for a deep dive into patterns over time. The two accompanying cards present the absenteeism rate and the average number of absent days per year. This page equips users with valuable data to address absenteeism challenges and make informed decisions regarding workforce management.
Power BI is used to develop a Comprehensive HR Analytics report
Even though we have many available technologies on the market, Power BI has a proven record of enriched dashboards and seamless integration with other data sets be it on-Prem or Cloud. An additional advantage is that we can leverage Office 365 and other Microsoft applications.
A few notable Advantages of Using Power BI: Power BI offers a range of advantages that make it a preferred choice for HR Analytics:
- User-Friendly Interface
- Interactive Visuals
- Real-Time Data
- Data Integration
- Shareability and Collaboration
- Mobile Compatibility
Most of the top companies in the Fortune 500 are extracting the benefits both functionality-wise and also profitability-wise using Power BI for HR Analytics.
Microsoft Power BI has once again been positioned as the leading platform in Gartner’s new Magic Quadrant for Analytic and Business Intelligence (ABI) Platforms.
The Bottom Line
The HR Analytics report built using Power BI serves as a game-changer in HR management. By offering insights into workforce trends, attrition factors, performance, and more, the report empowers HR professionals to make data-driven decisions that positively impact the organization’s growth and employee well-being. With its user-friendly interface, interactive visuals, and seamless integration capabilities, Power BI stands out as a versatile tool that revolutionizes HR analytics, making it an essential asset for modern organizations.
Author: Afridi Baig Jaffer, Data Analyst