Harnessing the Potential of the Placement Dashboard | From Campus to Career
What is Campus Placement?
Campus placement is a program conducted within universities or other educational institutions to provide jobs to students nearing completion of their studies. In this type of program, the educational institution partner with companies who wish to recruit students from those Campuses.
What is Campus Placement Dashboard?
The Campus Placement Dashboard is an interactive Power BI-enhanced dashboard with all the advanced features embedded. The super informative and visually appealing dashboard helps in the extraction of valuable insights in the form of a visual story.
How does the Placement Dashboard help Campus Management?
Campus Placement Dashboard drills down into placement data, thereby extracting insights and trends and helping the Management easily understand and analyze the student placement records over the past years and helping to take necessary steps for the betterment of the students as well as the institution.
Power BI Campus Placement Dashboard
The Power BI campus placement dashboard offers a comprehensive and visually appealing overview of placement statistics, enabling stakeholders to gain valuable insights quickly and efficiently. This intuitive dashboard provides interactive data visualization, allowing users to explore and analyze placement trends, student profiles, recruiter information, and more in a user-friendly interface.
Unlocking the Benefits of Campus Placement Dashboard
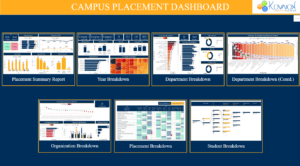
1) Landing Page
The “Landing Page” allows the user to get a gist of the contents of the dashboard and navigate along the available pages with just a click.
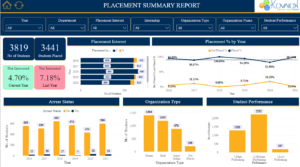
2) Placement Summary Report
The first page of the dashboard is the “Placement Summary Report”. It provides an idea of all the important factors relevant to the placement process of an institution, in the form of a visual story. The main idea behind this page is to:
Provide real-time access to key placement metrics, allowing college management to monitor and analyze placement performance.
Assist in evaluating the effectiveness of placement efforts.
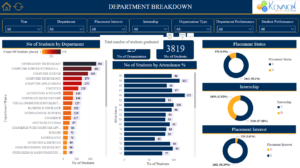
3) Department Breakdown
Next in store is the “Department Breakdown” page of the dashboard which emphasizes the department-wise metrics of the institution and their corresponding placement records in the last six years. This page aids in decision-making and interventions by analyzing the placement data through which the college management can :
Pinpoint departments or courses with lower placement rates and take corrective actions, such as enhancing curriculum, providing additional training, or conducting placement drives specifically for those areas.
Track the placement rates of different departments and identify departments that are doing well in terms of placement and departments that may need additional support.
Identify trends in placement and identify factors that may be contributing to the declining trend (if any) and develop strategies to improve the placement rate.
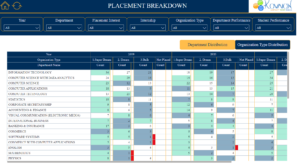
4) Placement Breakdown
Moving forward is the “Placement Breakdown” page of the dashboard which enables the user to consume the underlying placement data in the form of a simple table, distributed based on the various departments in the institute and the organization types visiting the institute for placements. This page provides assistance in:
Identifying placement trends and uncovering patterns in placement data.
Tracking which industries or job roles are in high demand, which organization types are the top recruiters, and the changing preferences of students enable proactive planning and strategic collaborations with companies.
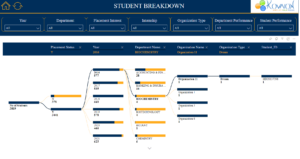
5) Student Breakdown
Next, the “Students Breakdown” page throws light on the decomposition tree visual, which is an AI-based visual embedded in Power BI which allows the user to slice and dice the data based on various factors and hence visualize the data across multiple dimensions. It gives a wider perspective in :
Tracking the placement rates of different student groups can be used to identify those who are doing well in terms of placement and those who may need additional support.
Comparing the placement rates of different student groups at different institutions and benchmarking the institution’s placement rates against other institutions and identifying improvement areas.
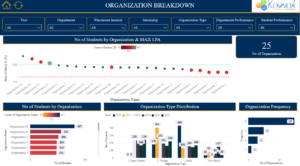
6) Organization Breakdown
The “Organization Breakdown” page deep dives into the relevant metrics associated with the organizations which have visited the campus. The page aims to :
Provide a visual representation of placement data, such as the number of companies visiting the campus, job roles offered, salary ranges, and placement trends which allows the management to make informed decisions about the career paths of students.
Give an understanding of the industry requirements by analyzing placement data and providing insights into the skills, qualifications, and requirements preferred by companies that help students align their studies and skill development to meet industry demands.
Track placement performance and enable the college management to track the placement performance of their respective departments or courses. They can compare placement percentages, average salaries, and other metrics across different academic years, helping them assess the effectiveness of their education and make informed choices.
The Bottom Line
Choose Kovaion for an unmatched Campus Placement Dashboard experience, ensuring effectiveness and efficiency in your recruitment process. Our cutting-edge technology empowers you with comprehensive insights, enabling you to make informed decisions for successful recruitment!
Author: Rituparna Dutta, Jr. Data Analyst